Debugging Complex Scala Code: Tried and True Approaches

In this article, I'd like to describe how my processes evolved and what breakthrough moments I had while fixing bugs in Dotty.
Tooling
Having the right tools while working on a problem is paramount. Try writing your next project in Notepad. No syntax highlighting, no code completion, no capability to see other files in your project. Ultimately your tools determine the success and the cost of your project.
This article describes some tools I have started to develop during my fork on Dotty that facilitate issue fixing. The recurring motivation for each tool is to save the time and effort of doing certain actions. This effect is good in itself but positive effects tend to lead to other positive effects. One such a positive second-order effect is that the lower the cost of some behavior, the more likely you are to adopt it when presented with the need an a possibility.
Concretely, consider navigating a Scala exception stack trace. In one case, the frames are not clickable from the terminal and you need to manually locate the file and the line indicated in the frame. In another case, you can click the frame and go to the line instantaneously. It is not only about saving the time when you go from the former case to the latter. It is about whether you are likely to bother jumping from frame to frame in your debugging process at all. If it routinely takes a few seconds to jump a frame, it may disrupt your line of thought, so you may avoid jumping altogether and look for other ways to solve the problem.
Issue Workspace
Debugging a Dotty issue usually involves compiling a misbehaving program dozens of times. On each compilation you make minor tweaks to the program, the compiler or the way the compiler is run.
The way the compiler is run is controlled by compiler flags. E.g. first you run the compiler with -Xprint:typer setting to see the trees after the typer phase. Next you need to use a flag that tells the compiler to show the tree ids alongside each tree in the -Xprint output. Then, you'll need to pass that id to yet another flag that will show the stack trace of the creation site of that tree.
Essentially, you have a command like this:
;dotc -classpath ~/.ivy/cache/local/lib1/lib1.jar -Xprint:typer -Yshow-tree-ids Foo.scala; dotr -classpath ~/.ivy/cache/local/lib1/lib1.jar Foo
You have to repeatedly run this command from Dotty's SBT shell and modify it frequently. From SBT, it is not convenient to modify the command and it can get lost easily if you execute other commands. Hence, a big breakthrough for me was to make a Dotty Issue Workspace.
Every Dotty issue becomes its own project. An issue project is stored in a separate directory and includes the issue source files and the script to launch them. The script is composed of SBT commands. The above command can be written in a launch script as follows:
dotc
  -classpath ~/.ivy/cache/local/lib1/lib1.jar
  -Xprint:typer
  -Yshow-tree-ids
  $here/Foo.scala

dotr
  -classpath ~/.ivy/cache/local/lib1/lib1.jar
  Foo
Then, from Dotty's SBT console, the issue foo command executes the issue stored in the folder foo by executing all the SBT commands in the launch folder.
The fact that each flag can be on its own line means you can easily comment them out.
Better Stack Trace
Consider the following:
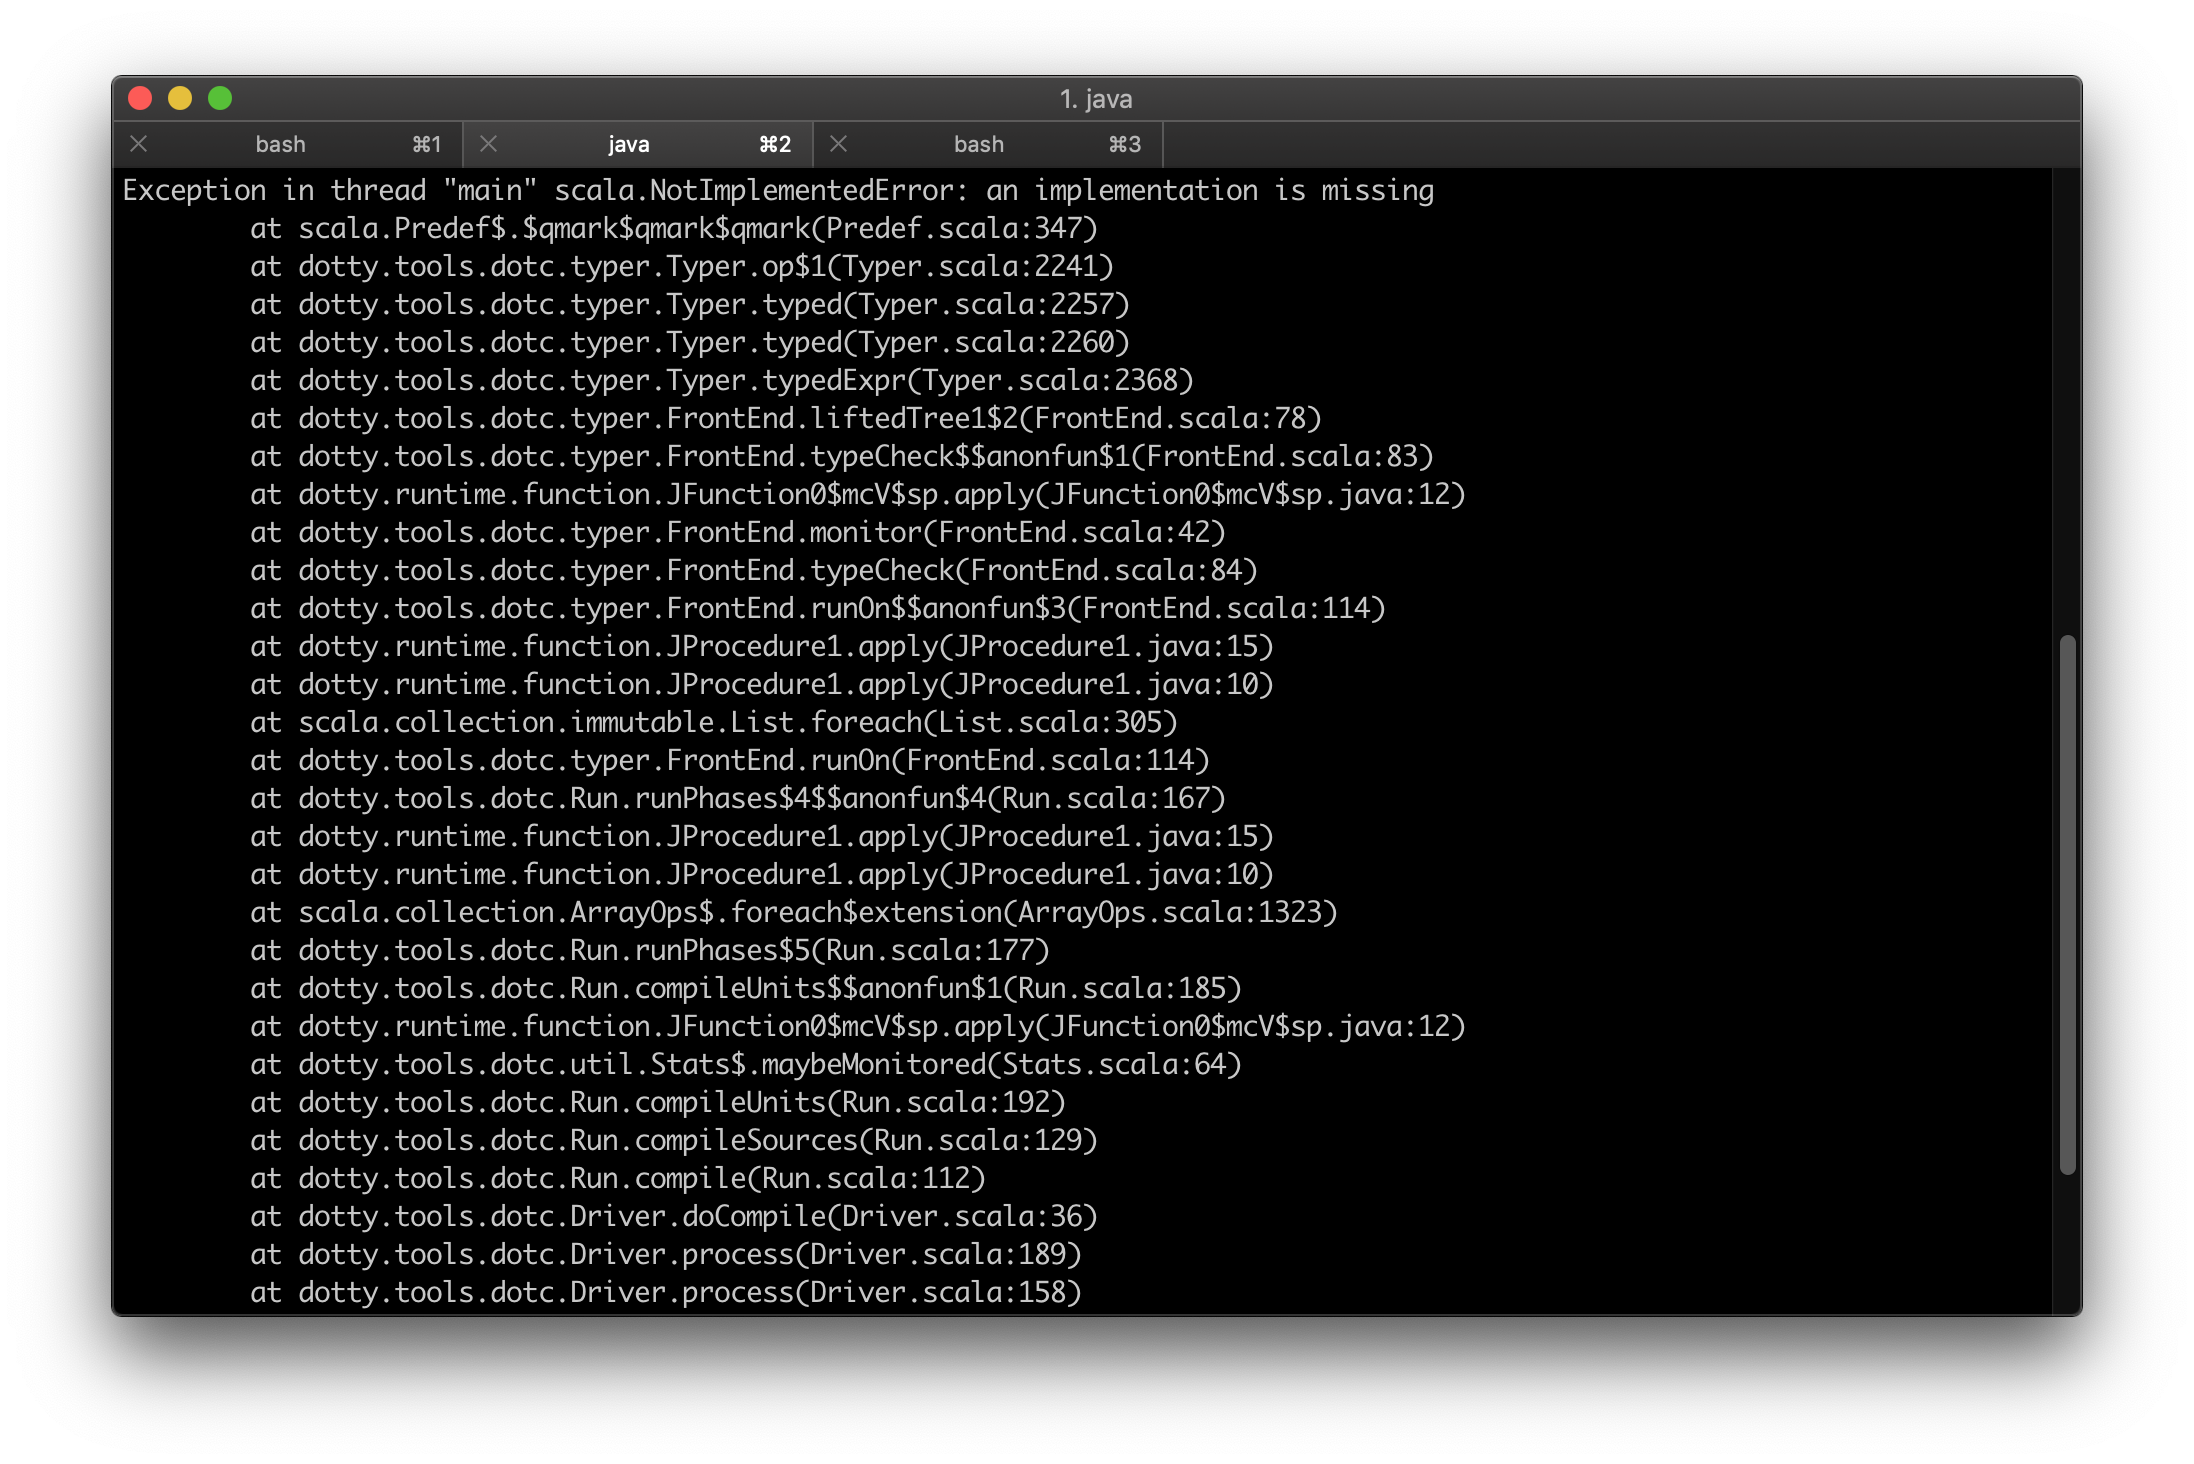
This is a stack trace from somewhere inside Dotty. They are your starting points of investigation in the issues that involve crashes. Alternatively you may deliberately cause them to see from which place a method was called.
One problem with the stack on the picture is that it is hard to see the method names of the stack frames. Another problem is that you frequently want to go to the line indicated by the stack frame, but there is no easy way to do it: you can't just CMD+click the frame because they are not links.
Now consider the following stack trace:
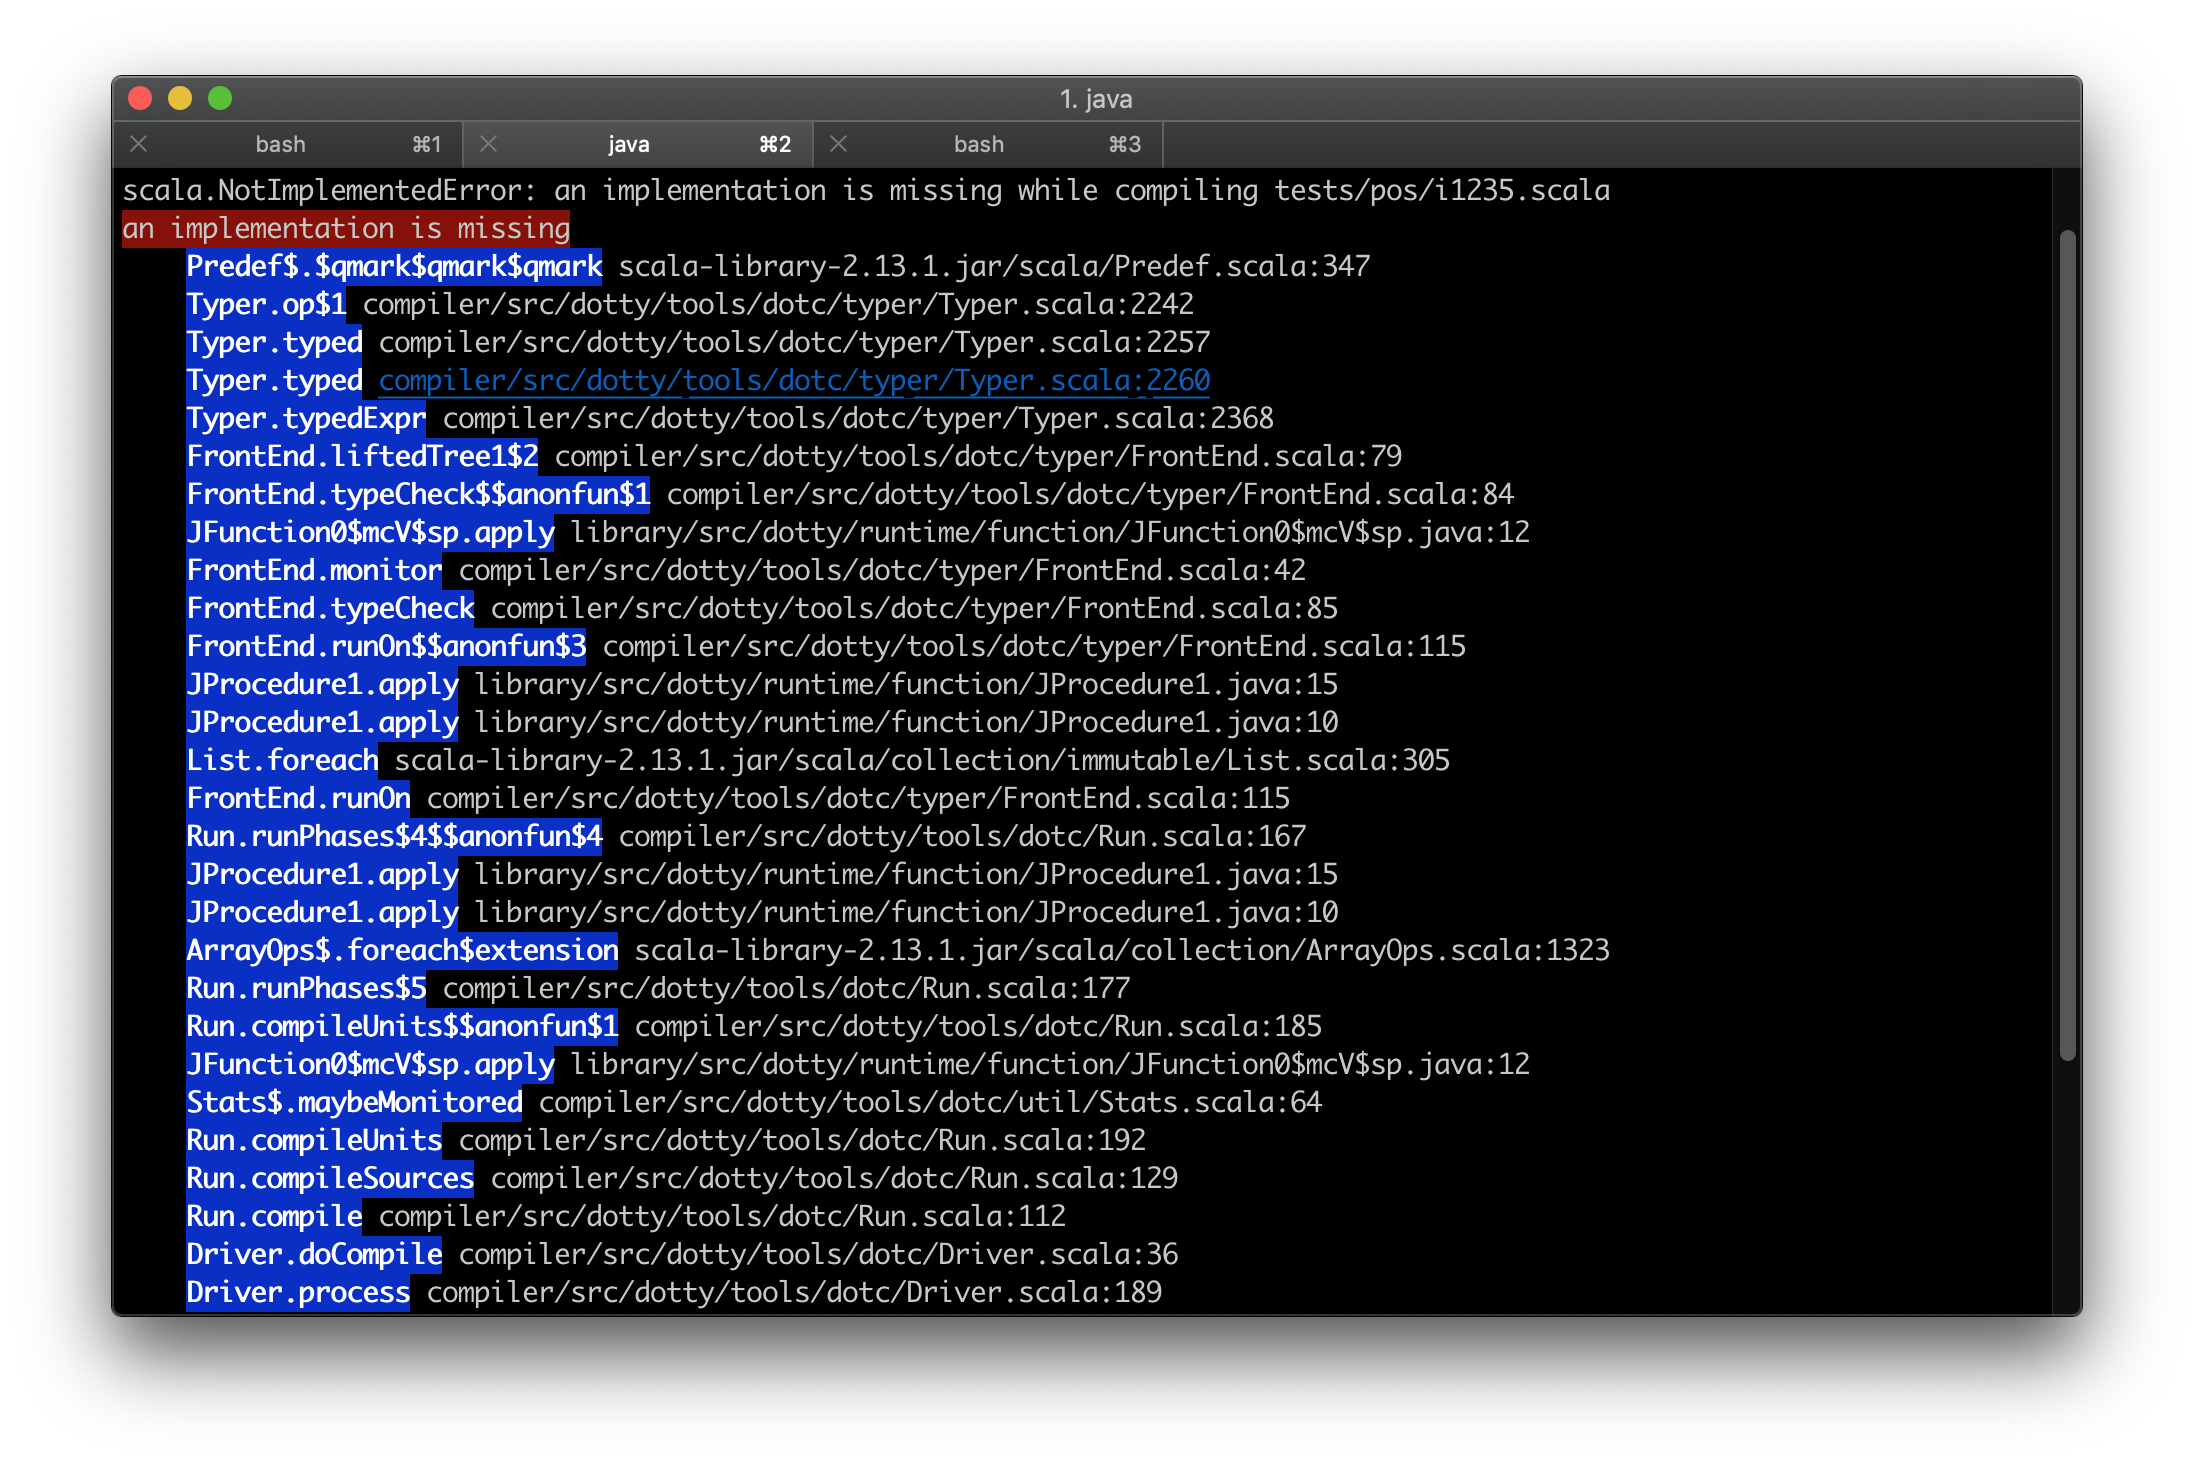
The method names are highlighted, so you can clearly see them. This is just about as important for stack traces as code highlighting for source code. The real game changer is that the source file paths are resolved. You can cmd+click them from iTerm to jump to the frame immediately. This saves a few seconds each frame and makes it much easier to explore the stack.
This pretty stack trace is available in the Entropy Mod for Dotty. The metaphor in the name is that when any kind of work is done, there's also a waste energy that increases disorder or entropy. Same in programming. The mod's objective is to provide tools to bring the chaos that accumulates during the compiler development under control.
Concept Maps
We think in terms of graphs: entities and relationships between them. In programming it is especially easy to notice this approach. Method typed calls method adapt after it calls typeUnadapted. adapt performs application of extension methods by calling extMethodApply, which in turn will call typed again, recursively. It is so easy to get lost in these relationships.
Fortunately, there is a tool to help in such a thinking process – the concept map:
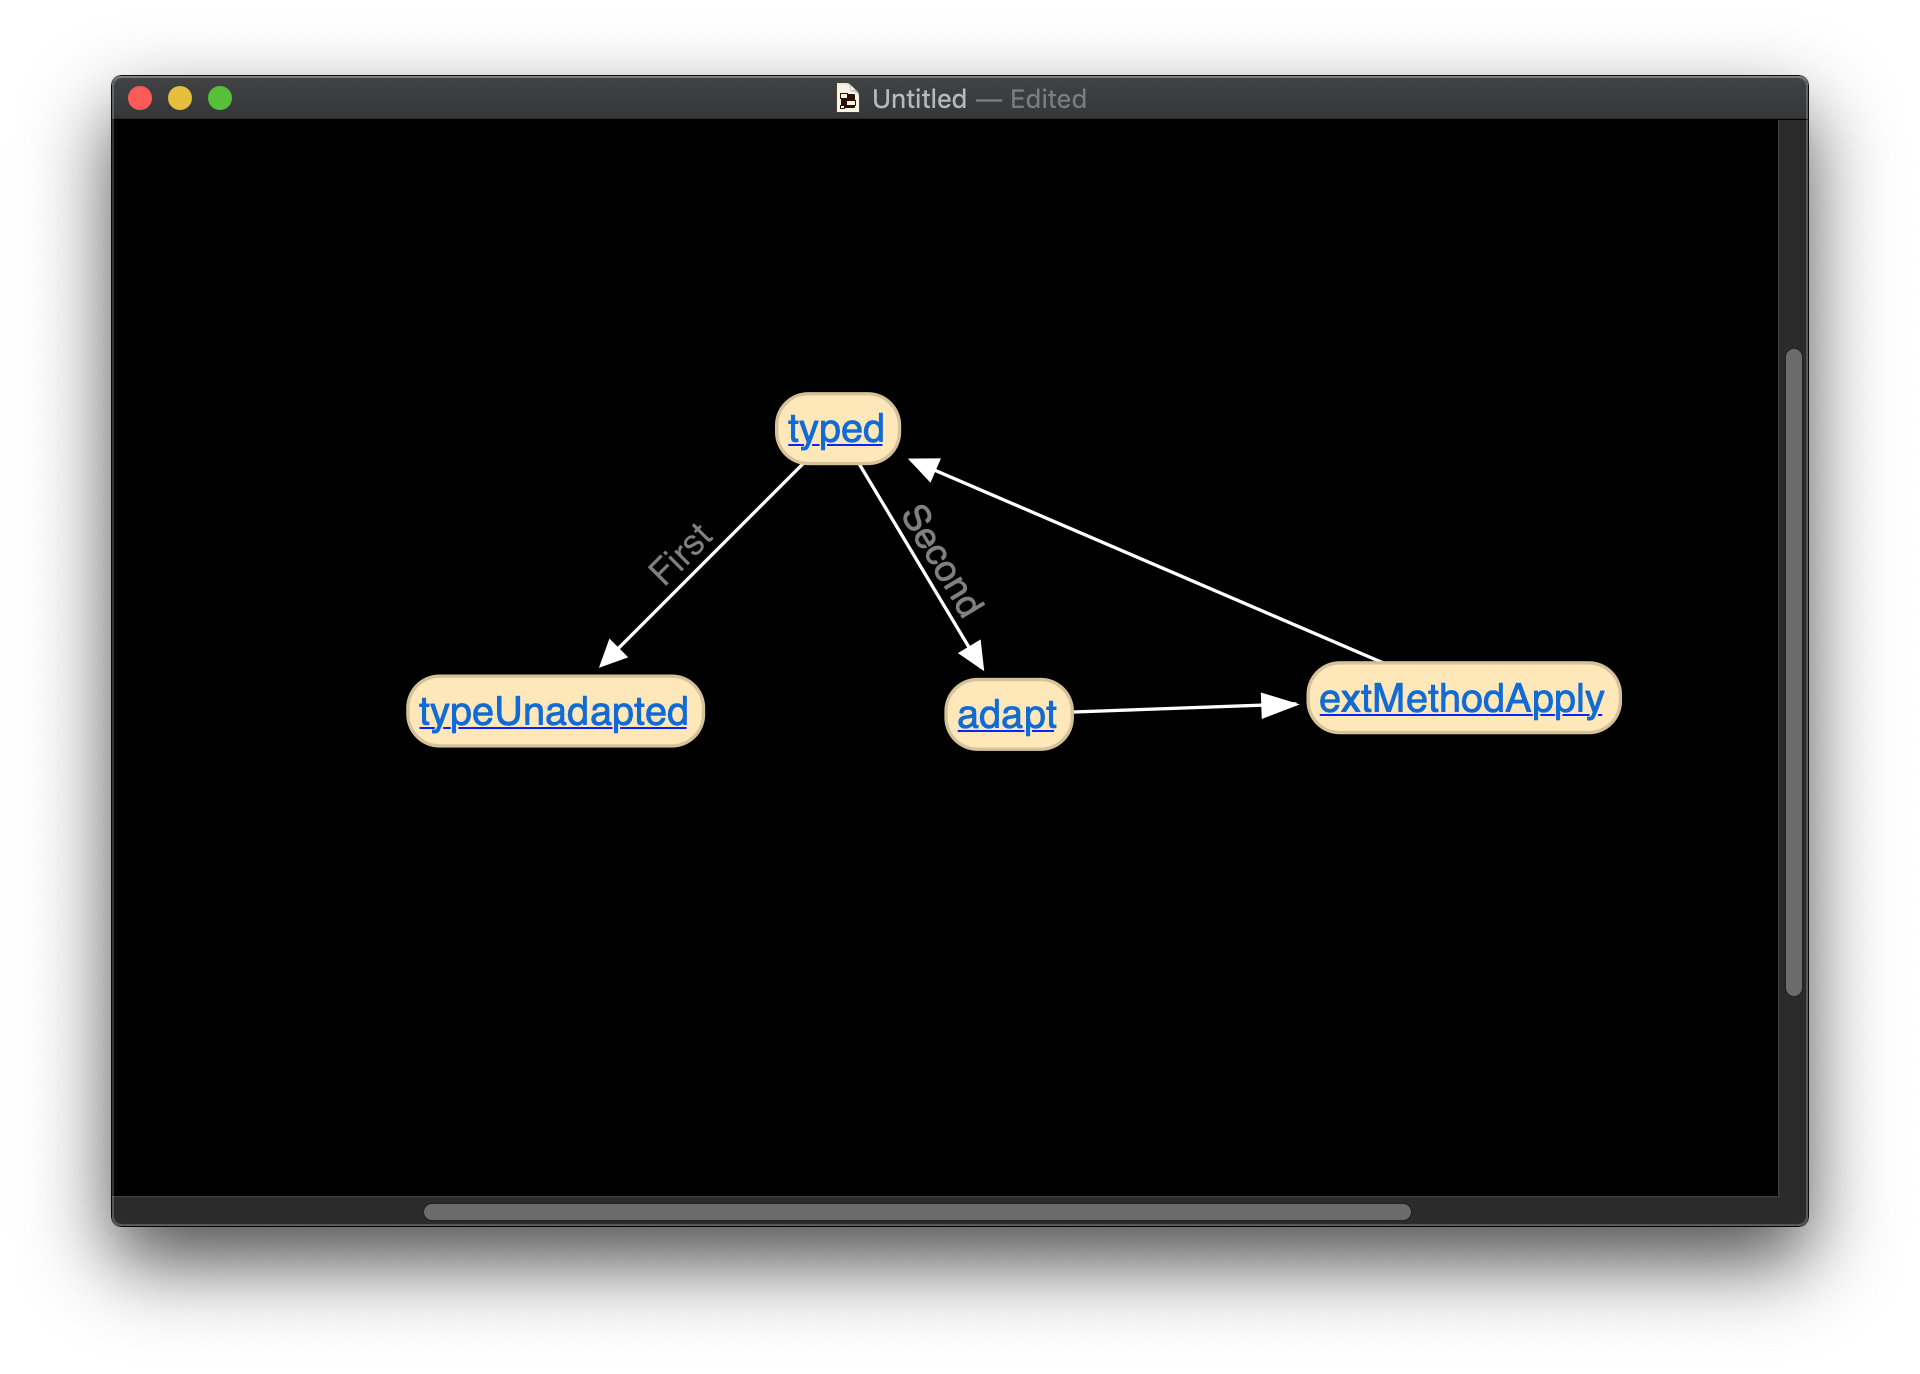
The software above is Scapple, the only one I found that has minimal distractions and supports rich text formatting (will become clear why it is crucial below).
If you have a complex set of relationships between entities in your head, you can unload it from your memory into your computer. This allows you to zoom in and out without losing track of the whole picture.
Notice also that the method names are highlighted as links. The links in question are in the form of sublime:///path/to/file.scala:200 which will take you to the given line in the given file on click. The handler for such links is implemented on the OS level and is not something that comes with Sublime. You can teach Mac OS to handle them – see, e.g., https://superuser.com/q/548119/1118459.
In my workflow, I also have a Sublime plugin that provides a shortcut which allows me to copy a chunk of source code as such a link. Whenever I feel I need to save some line of code while reading it, I copy it as a link and paste it into the concept map. It is possible because Scapple supports rich text formatting in its nodes. The Sublime plugin creates the appropriate rich text string when the shortcut is pressed. I may publish it one day once it's more polished but it's not hard to write it on your own if you know how to write plugins for your code editor.