Following Causal Chains in Dotty Codebase
In this article, I'm sharing my process of learning how to fix issues in complex codebases, such as the one of the Scala 3 compiler (otherwise known as Dotty).
Framing the Problem
You can deal with a problem in two ways. First, the intuitive way: go at it and follow your common sense. In process, however, you'll discover recurring patterns. Some sub-problem that pops up constantly or a technique you apply time after time. Hence the second way is to frame the problem. Give the recurring patterns names, describe how they relate to each other. This way, you develop the domain of the problem.
The advantages of having the problem framed are:
- You pay attention to what's important and filter out everything else. If you are working on intuition, every detail might matter. However if the problem and the solution are described in terms of some domain, all that matters is to see the entities of that domain.
- You are able to communicate your findings to others. This ability facilitates progress sharing and collaboration.
- You are able to store your findings for later use. With intuitive approach this is not the case by definition, since you don't have the words to describe what you see. The advantage here is that you're able to free your memory and mental resources and hence scale up the size of the problems you can solve.
The Domain of Debugging
Successful and Failing Cases
One recurring theme when dealing with Dotty issues is that you have a program which makes the compiler exhibit some unwanted behavior. For example, a recent issue #8188:
object Test {
  extension StrDeco on (tree: String) {
    def show(given DummyImplicit): String = ???
    def show(color: Boolean)(given DummyImplicit): String = ???
  }

  val c: Any = "foo".show
}
Produces the following compilation error:
11 |  val c: Any = "foo".show
   |               ^^^^^^^^^^
   |      value show is not a member of String.
   |      An extension method was tried, but could not be fully constructed:
   |
   |          Test.StrDeco.show("foo")
However, tweak it a little bit as follows:
object Test {
  extension StrDeco on (tree: String) {
    def show(given DummyImplicit): String = ???
    def show(color: Boolean)(given DummyImplicit): String = ???
  }

  val c: String = "foo".show  // The type of the variable has changed
}
And it compiles successfully. The existence of the program very close to the original one that doesn't exhibit the undesired behavior is interesting because if the programs are close, the compiler must also do more-or-less the same thing while compiling them.
It makes sense to give these two cases their own names, Successful and Failing respectively, thus defining our domain. There may be multiple of them since different modifications may produce different interesting behavior.
Deltas
An intuitive way to go about establishing the reason why the failing case exhibits the undesired behavior is to see what exactly the compiler did differently than in the successful case. This way of reasoning is especially appealing because one such difference is immediately obvious: the undesired behavior itself, for example a compilation error, and the absence of it in the successful case.
Since these differences are a recurring pattern, we can give them a name – Delta is a good one since it's usually used to indicate difference.
Once you have one such delta found, it usually points to another one: the one that causes it. You can uncover it by asking the question, "why did this difference take place?".
Then, you rinse and repeat until you arrive to the root cause of the undesired behavior.
You may need to do it dozens of times until you arrive to the root cause. Defining the concept of a delta enables you to record the deltas you've encountered, hence unloading your mind without fear of losing your progress.
Tracers
The tracers are statements that output something to the terminal. They are the primary way to detect the deltas.
Sometimes a single trace is printed more than once. This can happen in case of recursive methods or when a method is called from a loop. It is often the case that the correct and failing programs' traces are exactly the same – up to a certain point.
In the context of having a single tracer being potentially executed many times, the problem arises that it becomes harder to describe deltas. If that's just one tracing line for the successful and failing case, you can just specify that line as your delta. But if that's a hundred lines and the differences don't manifest until a few dozens lines in?
Motivated by the above, each individual tracer output can be labelled by an MD5 hash which is computed from both the string being output as well as all the other strings that were output previously as part of tracing.
This way, one can refer to the desired line of the tracing output by its hash and the delta definition boils down to naming the first hashes that were different for the successful and failing cases.
The Tracking of the Debugging Process
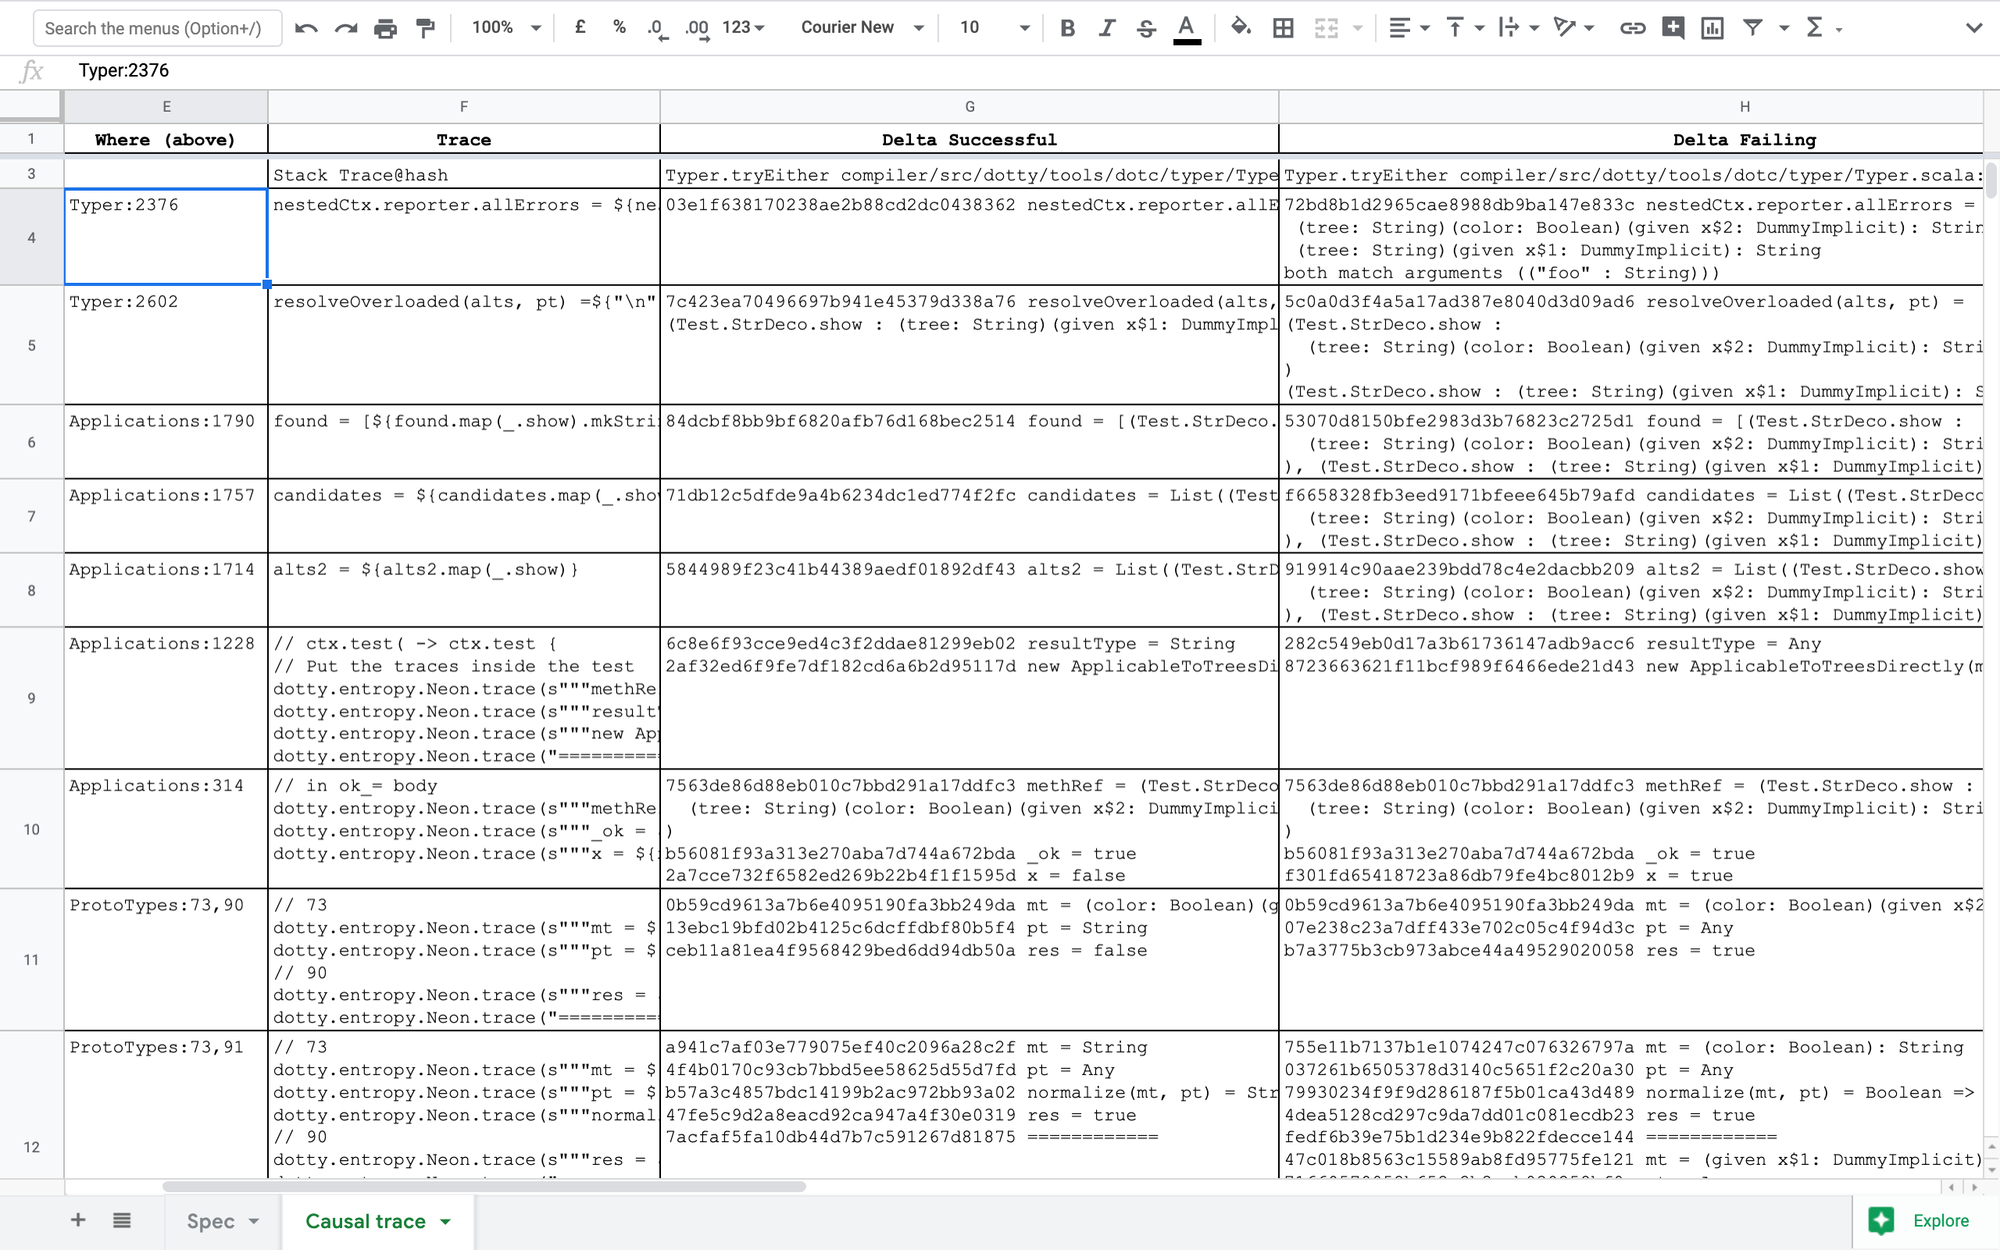
I tried out one way to capture the deltas last week. I have a spreadsheet like this:

The columns are as follows:
- Where (Above) – the line of code at which a tracer is injected. "Above" means "put the tracer on that line, above anything that was previously on that line".
- Trace – the string being output by the tracer. If the tracer is more than one command, write down the tracer code at that column, otherwise – just a string being printed.
- Delta Successful – for the successful case, what is the first trace entry that differs from that of the failing one?
- Delta Failing – for the failing case, what is the first trace entry that differs from that of the successful one?
Defined that way, the deltas are self-consistent: you can reproduce them on a clean codebase.

